

Photo Credit: www.sureshemre.wordpress.com
There is more to the motion of the moon than literally meets the eye. In July we discussed some basics of the moon’s motion circling the earth. This month we’ll see how the moon actually wobbles as it travels through space.
The fundamental equations and tables employed in the current orbital models for earth circling the sun and the moon around the earth were established in the 19th century by the American astronomer Simon Newcomb. These models are used for calculating when seasons change and the phases of the moon. They are also accurate enough for predicting lunar and solar eclipses, like the ones last month on August 7 (partial lunar) and 21 (total solar).
Speaking of eclipses, I traveled to Nebraska for last month’s total solar eclipse. I observed with relatives from a farm, located several miles southwest of Dorchester, owned by an extended family member. We had four generations present from each of three different branches. More about the eclipse later in this article.
The “Roche Limit” for a body like the earth, is the minimum distance that an orbiting body of similar composition can approach before becoming ripped apart due to tidal forces. Typically, it is about 2.5 times the radius of the primary, or larger, object. For the earth and moon, this center-to-center distance is a little under 6,000 miles. Fortunately, the moon is about 40 times farther away and is in no danger of breaking apart. Despite its distance though, Earth’s tidal forces dominate its moon.
An interesting property of the moon is that the same side always faces us at is revolves around the earth. Another way of saying this is that the moon is “tidally locked” in its orbit. Over time the earth’s gravitational force has slowed the moon’s rotation period until it equaled the period of revolution around the earth. In other words, as the moon orbits Earth, it slowly rotates keeping the same side facing us. When earthlings look up, they always see the same side of the moon staring down at them.
If that is the case then from earth one would always see only half – 50% — of the moon’s surface. Although it might be true at any given instant, over time the moon actually reveals more of itself than that.
“Librations” are subtle wobbling motions in which the moon tilts back and forth and oscillates to and fro. There are different forces causing the libration effects in various directions. Their discussion is beyond the space allowed for this article. The bottom line is that when these forces are combined, the net effect is that at any given time some point along the edge of the moon is tipped toward. Due to librations, we can see up to 59% of the lunar surface.
NASA’s Scientific Visualization Studio has a graphical web site that shows daily lunar information, including librations, for 2017 at svs.gsfc.nasa.gov/4537.
When we gaze at the moon it’s outside edge or “limb” appears smooth. However, around that edge are bumps and dents from mountains and valleys. Astronomer C.B. Watts published charts of the irregularities in these zones in the early 1960s. Over time, the Watts Charts were refined through various techniques, including timings of stars occulted by the moon. Knowing the precise location of an observer and the time that a given star eclipsed by the moon disappeared and/or reappeared allowed refinements to the lunar profile model in the so-called “marginal zone.”
In more recent years the Watts charts have been superseded. Spacecraft imagery taken from lunar orbit, including NASA’s Lunar Reconnaissance Orbiter (LRO), are the basis for new charts such as the Kaguya/LRO. One use of such charts is predicting the “Bailey’s Bead” phenomena that accompanies total solar eclipses.
As the last shrinking arc of sunlight is eclipsed, the moon’s ragged edge causes the arc to break up into what are termed Bailey’s Beads, named after 19th century British astronomer Francis Bailey who observed and explained the effect during an eclipse.
I photographed Bailey’s Beads through a telescope at last month’s total solar eclipse. An online interactive Google map created by Xavier M. Jubier includes predictions of Bailey’s Beads for any location along the eclipse path by taking into account the Kaguya/LRO lunar profile charts as well as lunar libration motion. When compared side-by-side, the Bailey’s Beads image very closely matched the predicted effect from Jubier’s web site (xjubier.free.fr/tse2017map).
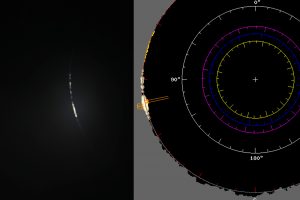 |
| Left: “Bailey’s Beads” phemomena just prior to start of the August 21, 2017 total solar eclipse. Right: Kaguya/LRO chart lunar profile and Bailey’s Bead predictions for observing location and time. Credit: Curtis Roelle (left) and Xavier M. Jubier (right) at xjubier.free.fr/tse2017map. |
The next solar eclipse in the continental United states is on April 8, 2024, from San Antonio, Texas through Caribou, Maine. At maximum eclipse in Mexico, totality lasts nearly 4 ½ minutes, compared to just over 2 ½ minutes for the 2017 eclipse. Early planners may want to check out Jubier’s map for the 2014 eclipse, at xjubier.free.fr/en/site_pages/solar_eclipses/TSE_2024_GoogleMapFull.html.
— Curtis Roelle